1st March 2017
Summary
- Wide spread evidence of low levels of coral mortality from the recent 2015/16 summer bleaching event.
- Seven of ten reefs had small declines in coral cover since they were last surveyed.
- Coral cover remained stable on two reefs and increased on one reef.
- Coral cover ranged from low (5-10%) to high (30-40%).
- There was ongoing crown-of-thorns starfish (COTS) activity on six of ten reefs surveyed with one reef classified as an Active Outbreak.
- Only a few scattered bleached coral colonies persisted on most reef slopes
- Numbers of coral colonies with signs of disease were generally low, though there were some localised hotspots (e.g. Flank of Creech(a) Reef)
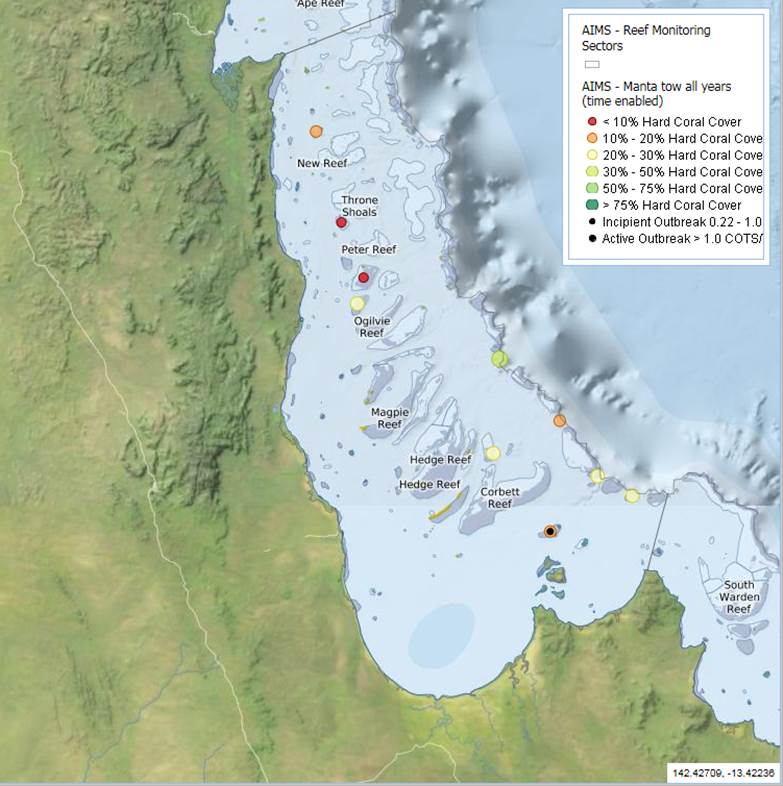
Map showing location of reefs in the Princess Charlotte Bay sector. Click on figure to go to AIMS Spatial Maps for information on individual reefs.
|
Princess Charlotte Bay Sector |
Summary |
Trend since last survey |
|
Median Coral Cover: |
Low (10-20%) |
Increased |
|
COTS status: |
Not outbreaking |
Decreased |
|
Coral disease: |
Overall Low: Increased incidence on one reef |
Stable |
|
Coral bleaching: |
Low: large areas of coral mortaility from 2015/16 summer bleaching were observed. |
Increased |
As part of the Long Term Monitoring Program (LTMP), surveys of coral cover and abundance of the coral feeding crown-of-thorns starfish (COTS), Acanthaster planci, were completed on ten reefs in the Princess Charlotte Bay sectors of the Great Barrier Reef (GBR) using the manta tow technique.
Median reef-wide live coral cover (coral cover) was variable on reefs in the Princess Charlotte Bay Sector ranging from low (5-10%) to high (30-40%) and had declined on five of nine reefs since they were last surveyed. Coral cover was low on Celebration and Blanchard, and high on Creech (a) Reef. Coral cover was moderate (10-30%) on the other six reefs surveyed (Table 1). Coral cover had decreased on seven reefs (13-121, Blanchard, Celebration, Clack, Creech(a), Davie and Rodda) remained stable on two (13-124, Osborne) and increased on one reef (Morris Island). Declines in coral cover were likely due to the combined effects of ongoing COTS activity and the 2015/16 summer bleaching event. For example Clack Reef remained classified as an Active Outbreak and localised Incipient Outbreaks levels of COTS were recorded at both Morris Island and Osborne Reef.
At the same time extensive recently dead coral was recorded at Osborne Reef, Celebration Reef, Blanchard Reef and Morris Island Reef. These stands of recently dead coral most likely resulted from bleaching in the summer 2015/16. While recent coral mortality was higher than normal, reefs in this sector were not as badly affected as many of those further to the north (i.e. Cape Grenville).
In general, overall COTS abundance on reefs in Princess Charlotte Bay sector was similar to previous surveys and indicates continuing low level COTS activity on reefs in the region. COTS were observed on six of ten reefs surveyed and one reef (Clack Reef) remained classified as an Active Outbreak.
Levels of coral bleaching during surveys were low and restricted to small numbers of scattered coral colonies on reef slopes. Similar low levels of white syndrome disease were recorded from all reefs in the sector. Corals that bleach may not die initially, but in their weakened state they may become susceptible to disease. This was apparent on the second flank of Creech (a) Reef where white syndrome was abundant affecting more than ten coral colonies per two minute manta tow. Low levels of black band disease were recorded from Osborne and Rodda reefs.
Results are summarised in Table 1. Details of the manta tow method can be found in the Standard Operational Procedure No. 9 [AIMS Research - Crown-of-thorns Starfish and Coral Surveys - Standard Operational Procedure 9]. Further details of the monitoring program design, sampling methods and a full explanation of the COTS outbreak terminology can be found on the AIMS website.
Table 1. Summary of manta tow surveys for reefs in the princess Charlotte Bay sector.
|
Reef |
Shelf Position |
Tows |
COTS |
COTS per tow |
Median Live Coral Cover |
Median Dead Coral Cover |
Median Soft Coral Cover |
Reef Status |
|
Inner |
83 |
19 |
0.23 |
10-20% |
0-5% |
0-5% |
AO |
|
|
Inner |
43 |
7 |
0.16 |
10-20% |
20-30% |
0-5% |
NO |
|
|
Mid |
71 |
7 |
0.1 |
20-30% |
0-5% |
5-10% |
NO |
|
|
Mid |
106 |
10 |
0.09 |
5-10% |
5-10% |
0-5% |
RE |
|
|
Mid |
54 |
1 |
0.02 |
5-10% |
5-10% |
0-5% |
NO |
|
|
Mid |
74 |
15 |
0.2 |
20-30% |
5-10% |
0-5% |
NO |
|
|
Outer |
44 |
0 |
0 |
5-20% |
0-5% |
0-5% |
NO |
|
|
Outer |
41 |
0 |
0 |
30-40% |
0-5% |
0-5% |
NO |
|
|
Outer |
43 |
0 |
0 |
20-30% |
0-5% |
0-5% |
NO |
|
|
Outer |
44 |
0 |
0 |
20-30% |
0-5% |
0-5% |
NO |
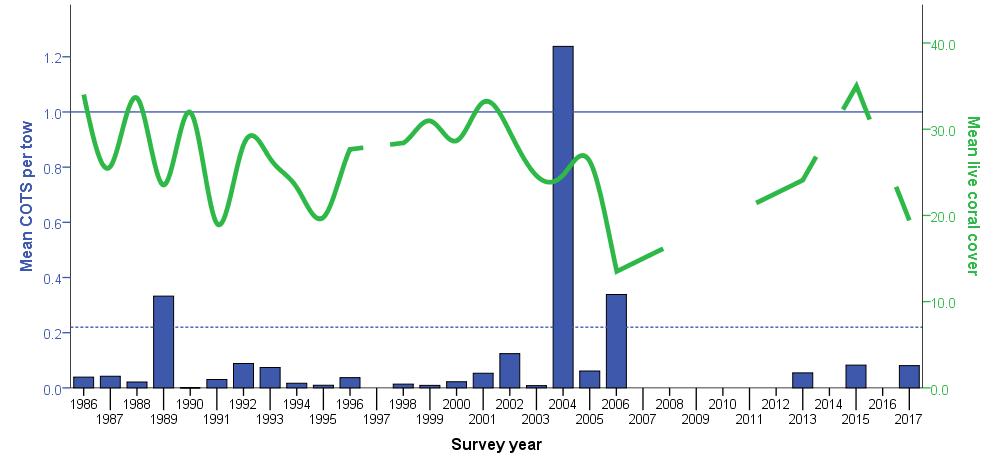
Graph showing changes in crown-of-thorns (COTS) (blue bars) numbers and coral cover (green line) through time for all survey reefs in the Princess Charlotte Bay sector of the GBR. Mean COTS/per tow is the mean number of COTS counted per two-minute manta tow for each reef averaged over all survey reefs in the sector. Mean coral cover is the mean percent coral cover per two-minute manta tow recorded on each reef averaged over all survey reefs in the sector. Dotted blue line indicates Incipient Outbreak densities of COTS (0.22 COTS/tow) that may be expected to reduce regional coral cover and the solid blue line indicates Active Outbreak densities of COTS (1.0 COTS/tow) that are certain to reduce regional coral cover. Gaps in coral cover indicate years when reefs in the sector were not surveyed.
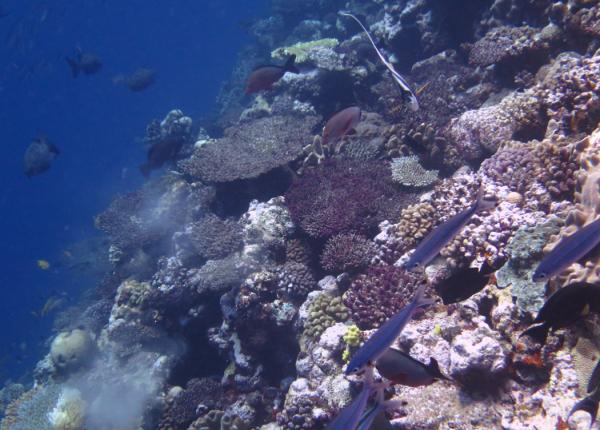
Reefs in the Princess Charlotte Bay sector were less affected by bleaching than reefs in some areas of the northern GBR, but there was still clear evidence of recent coral mortality. In this photo taken on the front of Reef 13-121 recently dead corals covered with dark turf algae can be seen crowding the reef slope.
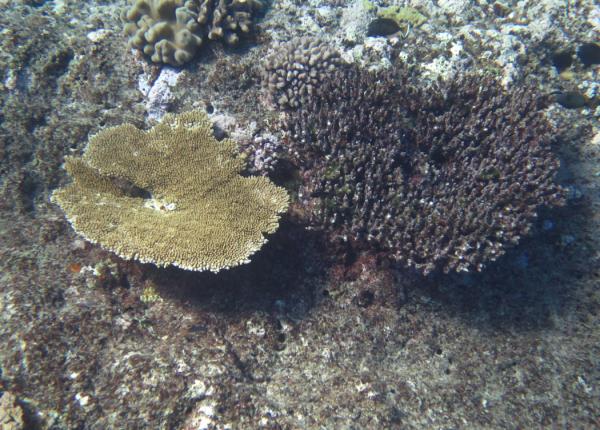
Some corals survived the bleaching conditions in summer 2015/16 while others did not.
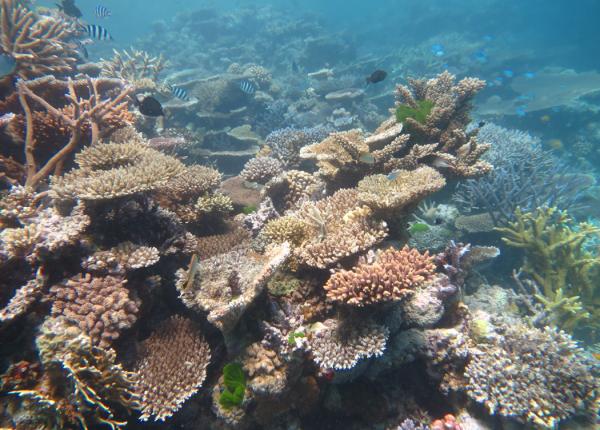
Vibrant coral communities could be found on many reefs in the Princess Charlotte Bay sector despite the 2015/16 summer bleaching conditions. This photo was taken on the flank of Creech(a) Reef.


