Tracking a monster: the unprecedented path of severe Tropical Cyclone Narelle across Australia’s coral reefs
Share this:
By AIMS spatial ecologist Dr Marji Puotinen
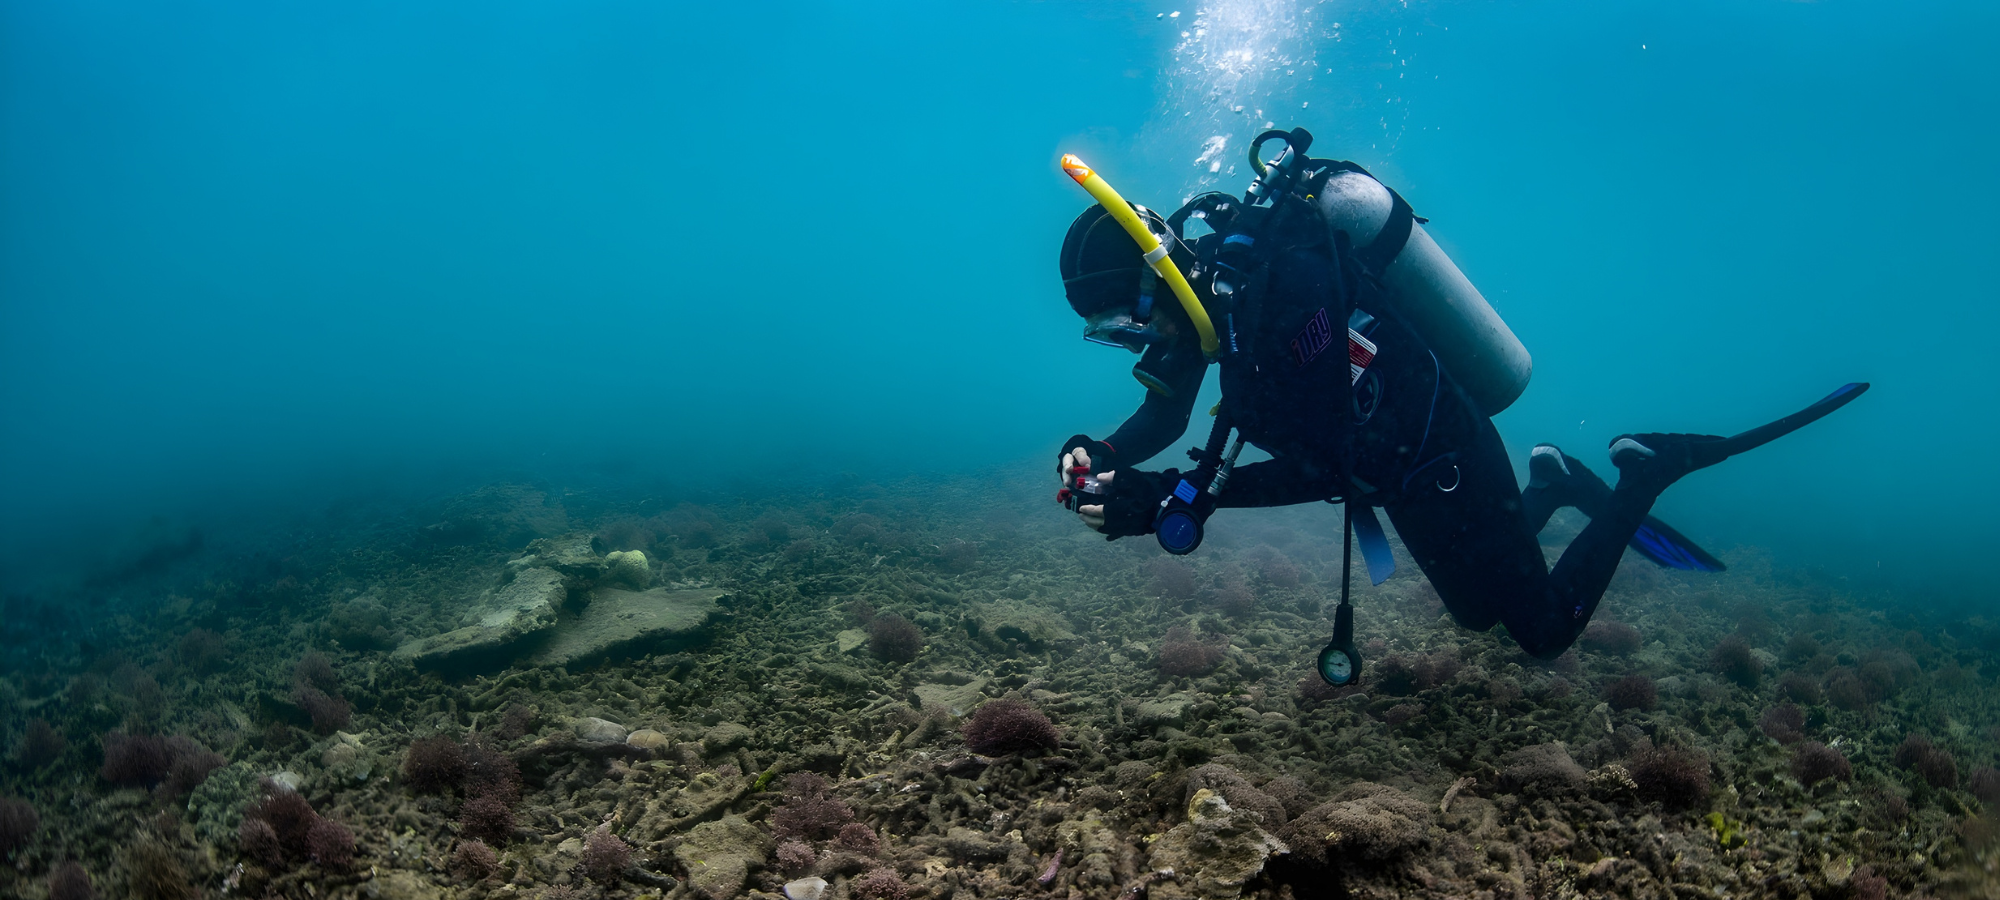
Coral reefs are important in many ways, but did you know that they play a major role in protecting much of the world’s coastlines from erosion by blocking up to 90% of incoming wave energy?
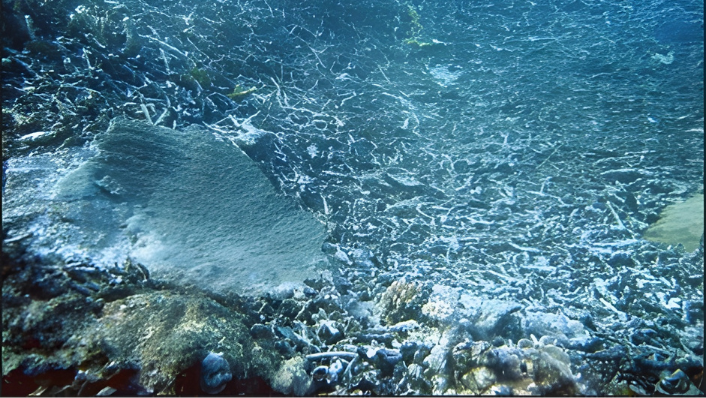
However, during a tropical cyclone, the waves breaking on reefs can be much larger than normal. This can cause major structural damage to reefs, from widespread breaking of corals to changes in water flows through the reef system.
Cyclones vary in their destructive potential to reefs based on their intensity (measured by category from 1 to 5, with 5 as the most intense), size, and how fast they move or how long they last. The most damaging cyclones are those that are strong, big, and slow moving or long lasting.
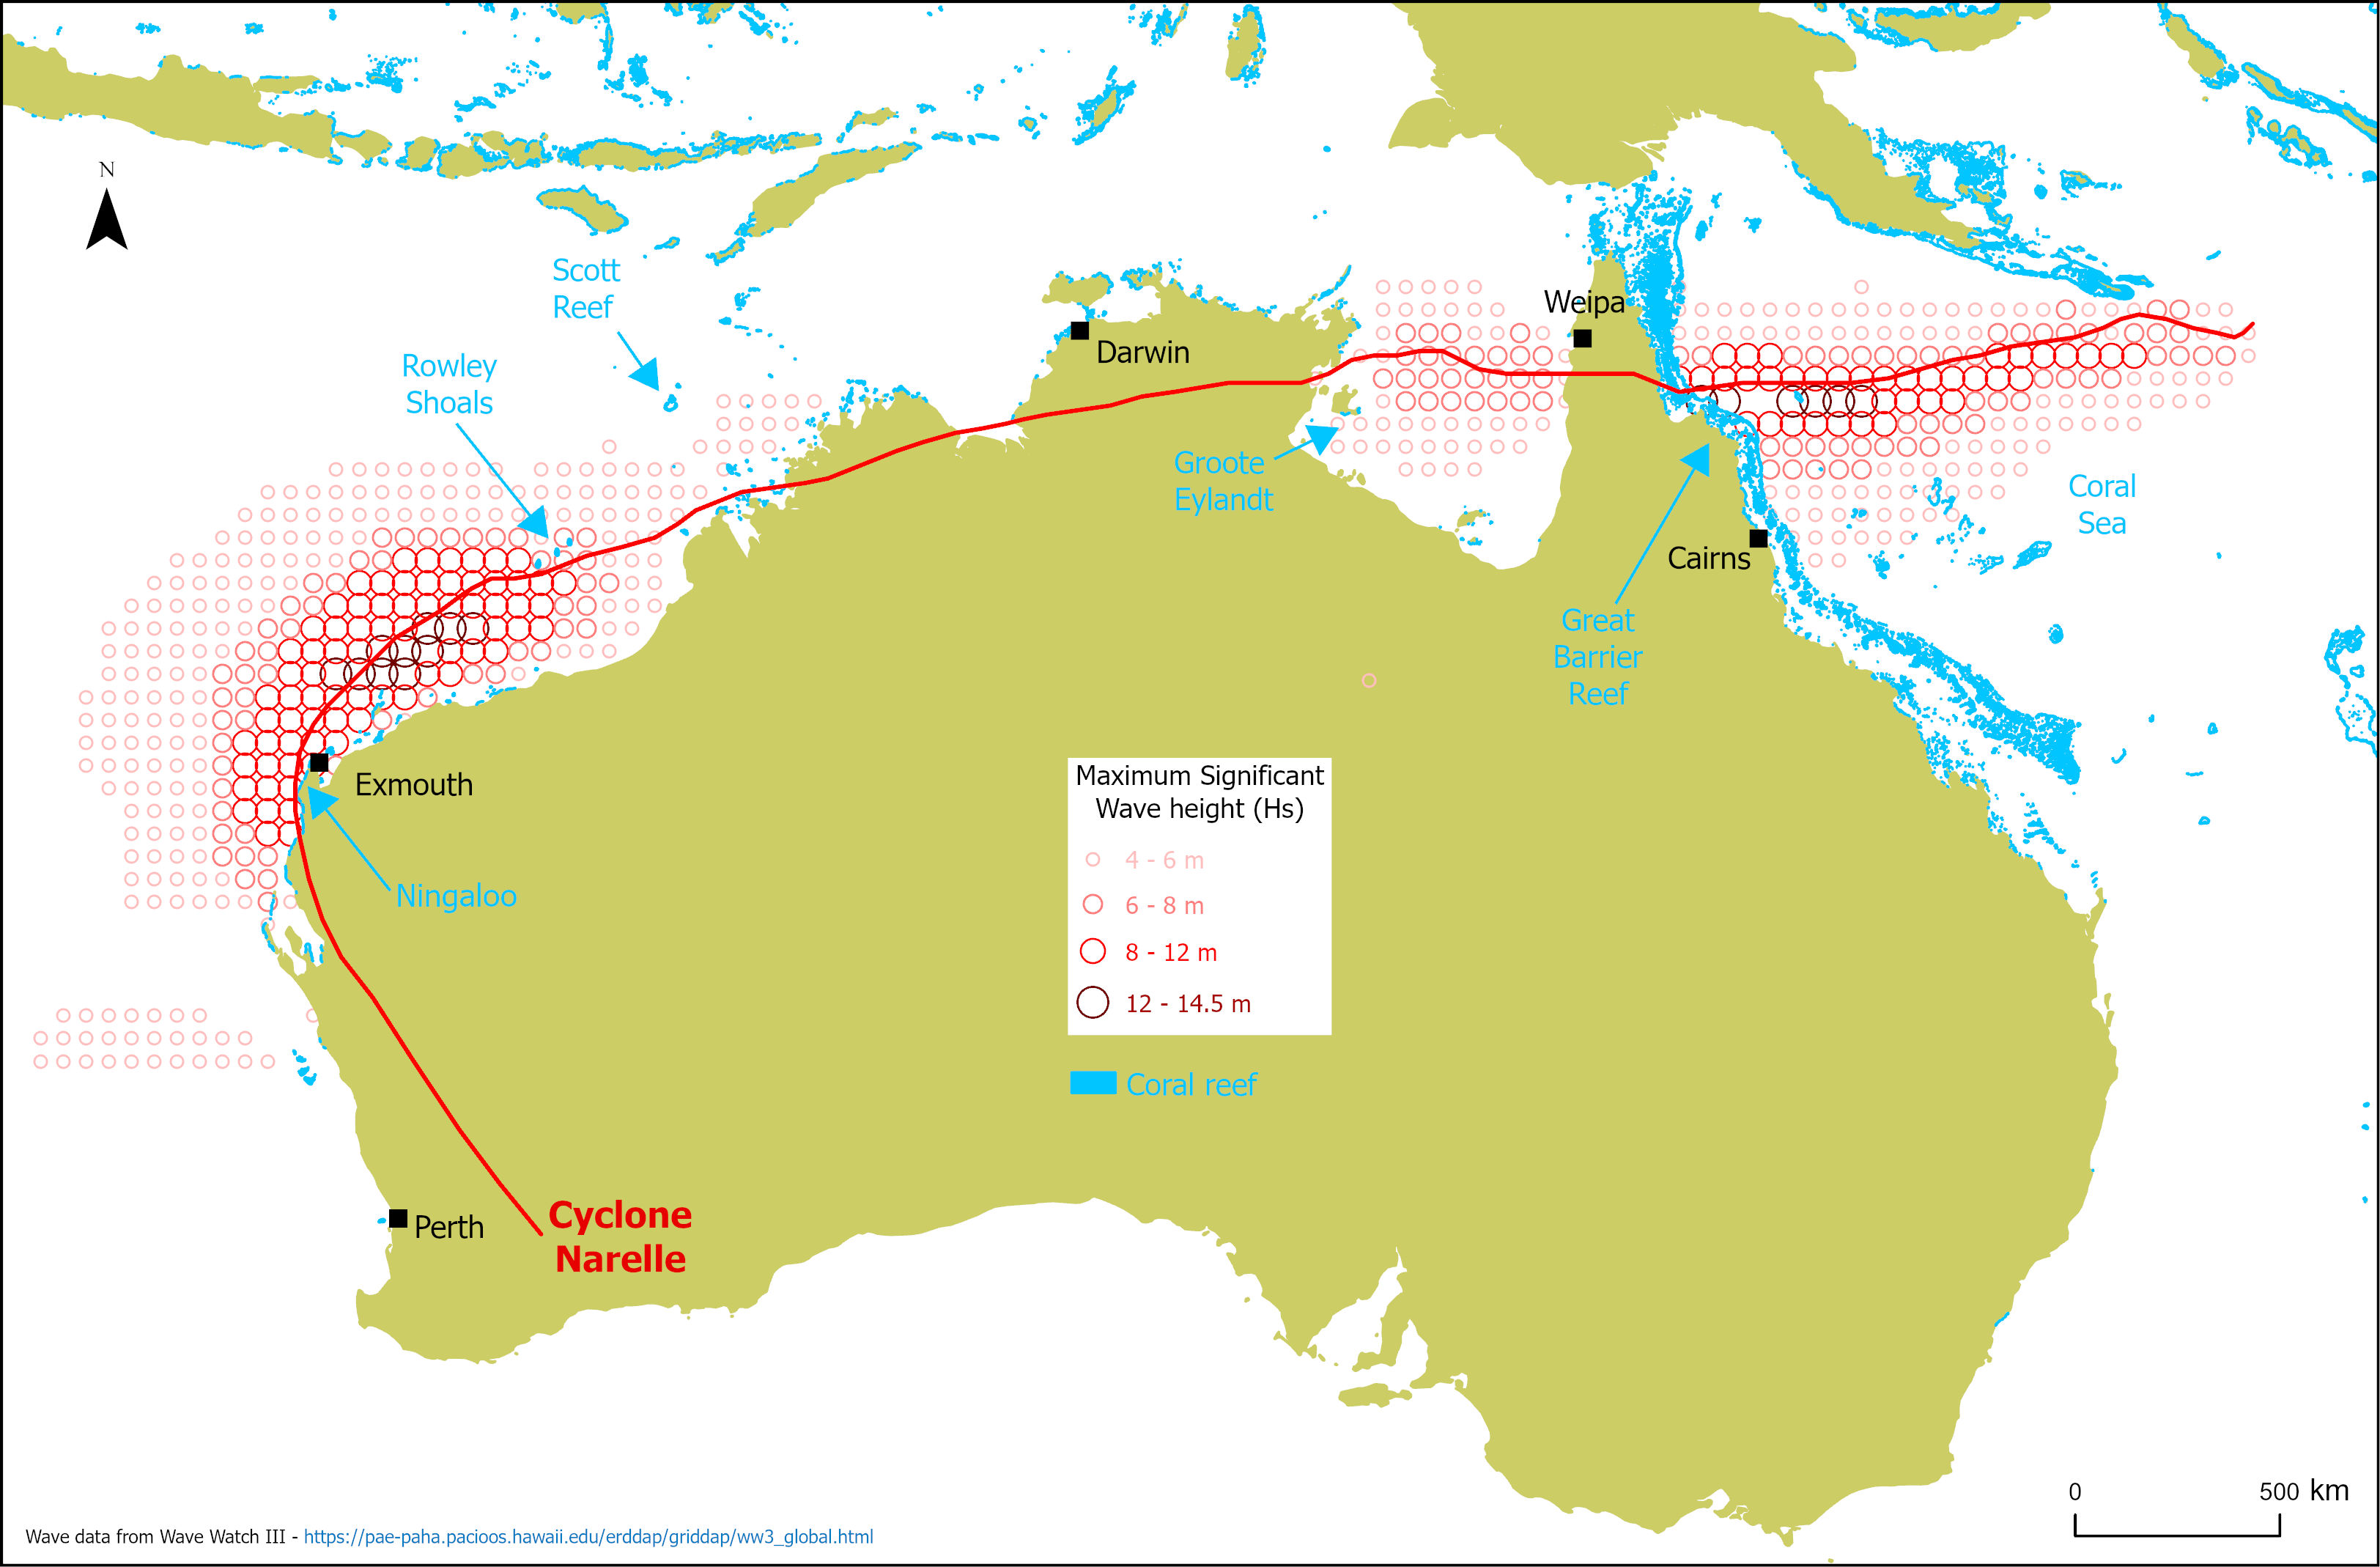
Since 1970, 835 cyclones have crossed within Australian waters (see map below), but only six have crossed the entirety of northern Australia from the Coral Sea to the Gulf of Carpentaria to the Indian Ocean. Of these, only Ingrid (2005) and Narelle (2026) did so at high intensity (at least category 3) along their tracks.
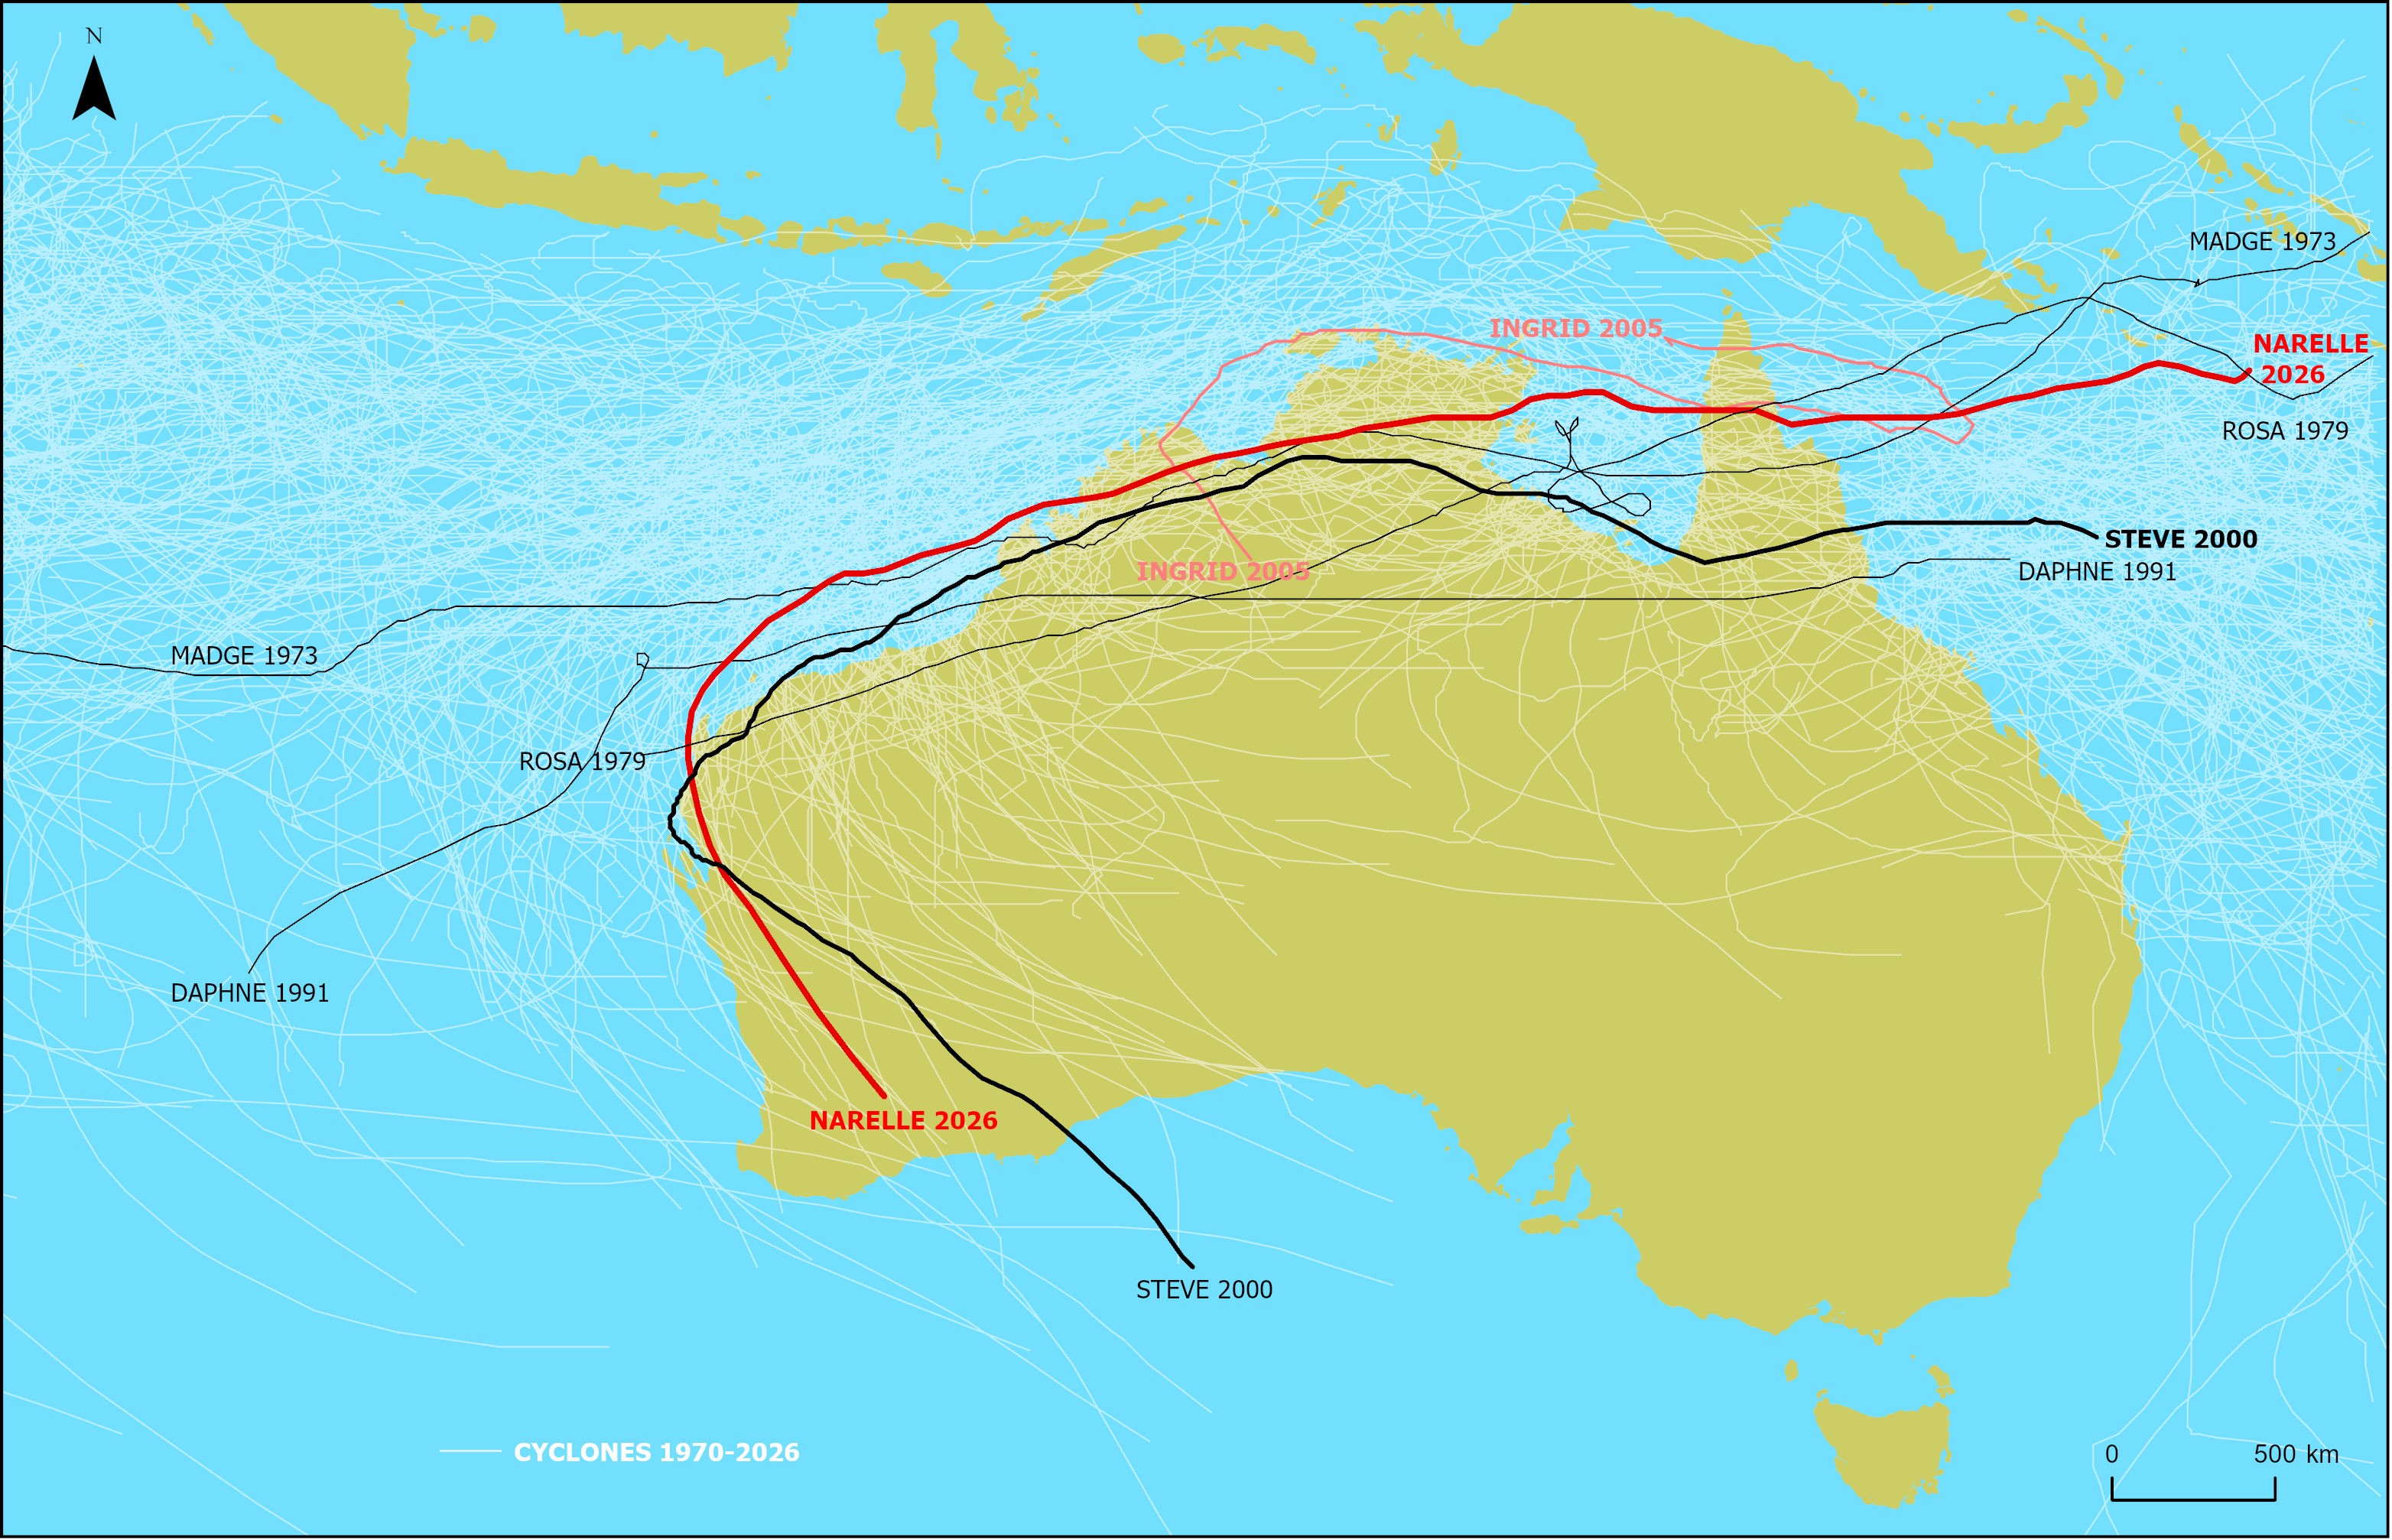
The track taken by severe Cyclone Narelle was unprecedented because it passed close to coral reefs all across northern Australia that are periodically surveyed by the Australian Institute of Marine Science and our partners:
- the Great Barrier Reef,
- Groote Eylandt in the Gulf of Carpentaria
- the Rowley Shoals / Ningaloo Reef in the Indian Ocean
Numerical wave models predict that very large waves near these reefs were possible – shown as larger and deeper red circles in the map below (data here) – with significant wave heights up to 13 metres high at outer shelf reefs in the far northern Great Barrier Reef (Princess Charlotte Bay, Queensland) and 11 metres high near the northern Ningaloo Reef at Exmouth, Western Australia.
Scientists estimate how rough the seas are in a given location by finding the top one-third highest waves and taking the average – this is called significant wave height. The largest possible wave could be up to twice as high as this!
For the Great Barrier Reef, the most severe damage likely happened at mid to outer shelf reefs north of Lizard Island, and no severe damage should be found south of Hinchinbrook Island.
In the Gulf of Carpentaria, fringing reefs along the southern part of Groote Eylandt are most likely to be damaged.
In Western Australia, Scott Reef likely dodged the bullet, but damage is possible at the Rowley Shoals and severe damage is very likely at Ningaloo Reef. Many of these reefs were bleached in the Australia-wide heat stress event in summer 2024-2025 that covered much of northern Australia and are thus at increased risk of damage from Narelle’s big waves.
It is important to realise, however, that because reefs are so good at absorbing wave energy, wave damage is always highly patchy even during the most severe cyclone. One part of a reef can be destroyed but another part only a 10-minute swim away can be untouched. This happens because the first part of a reef that waves hit absorbs most of the energy (and gets damaged), creating a shelter effect beyond this. Consequently, we won’t know the true scope of the damage until observations in the water can be made.
I’ve provided technical advice about Cyclone Narelle to the Great Barrier Reef Marine Park Authority, who are using this to plan a field survey to Princess Charlotte Bay in late April. And the AIMS’ Long-Term Monitoring Program will be visiting reefs north of Lizard Island later in the year. In Western Australia, AIMS and partners regularly visit the Rowley Shoals and Ningaloo Reef. These data will be invaluable for understanding the long-term impact of Cyclone Narelle on Australia’s coral reefs.
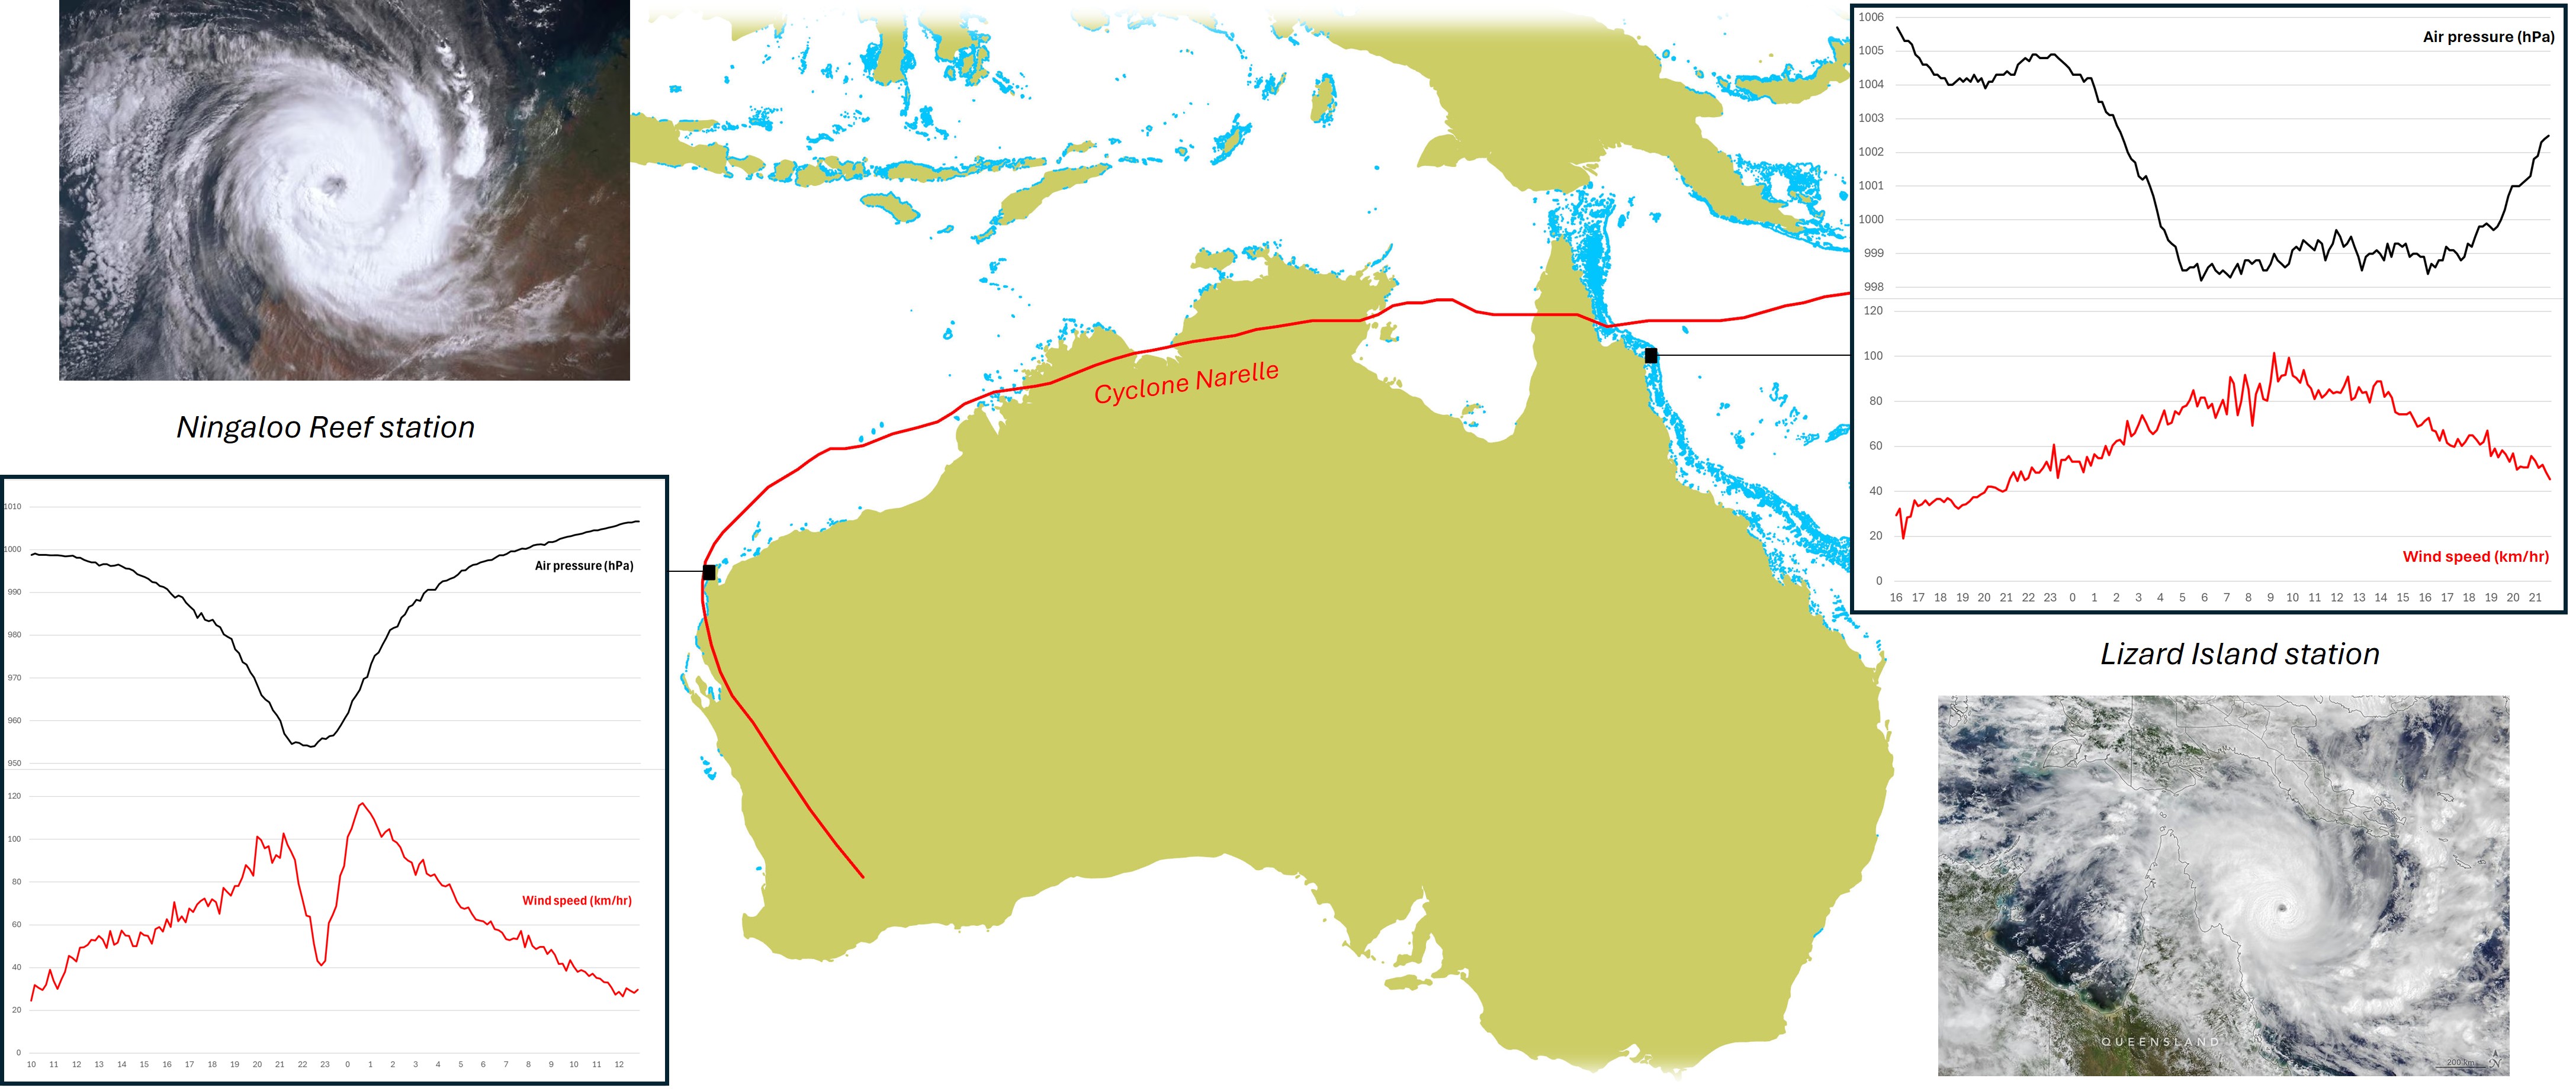
AIMS also maintains a network of automatic weather stations across northern Australia, which captured the passage of Cyclone Narelle (see below). For example, in a rare occurrence, the eye of the cyclone passed directly over the Ningaloo Reef weather station while at category 4, creating the classic dip in air pressure and peaks in wind speed as the eye wall passed over. For Lizard Island near Cairns in Queensland, the cyclone was further away, and this pattern was less pronounced.
Very long-lived cyclones like Narelle (18.5 days) that sustain high intensity have been very rare around the world – on average, cyclones from 1942 to 2023 spun out in less than 4 days. Most cyclones fizzle out once they pass over land or track into cooler water.
As Earth’s oceans continue to heat with climate change, however, this provides an escalating risk that intense cyclones like Narelle will last longer and affect more reefs – and people. This makes it all the more important for AIMS, with our collaborative partners, to continue to track tropical cyclones and record the effect they have on the health of Australia’s iconic coral reefs.