Long-Term Monitoring Program
Annual Summary Report of Coral Reef Condition 2024/2025
Substantial impacts from 2024 mass coral bleaching and cyclones reduce regional coral cover to near long-term average
6th August 2025
Download the 2024/2025 report | 6.7MB
Download the 2024/2025 report | 6.7MB
Executive summary
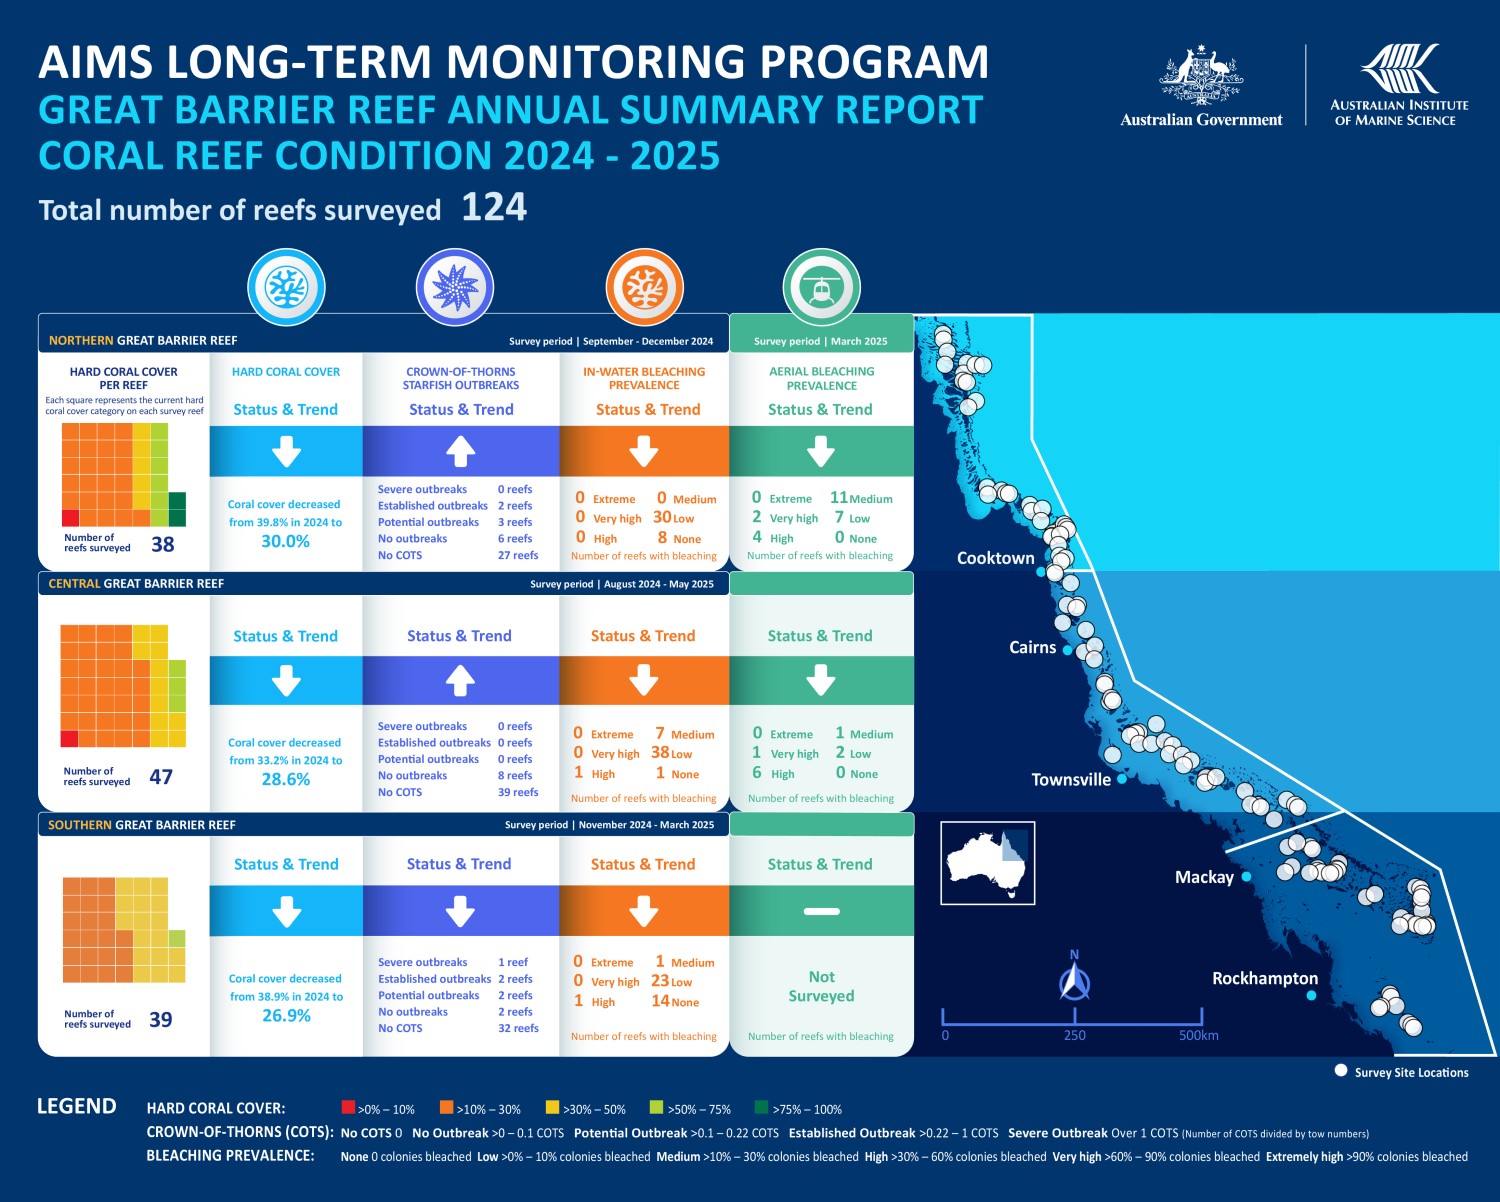
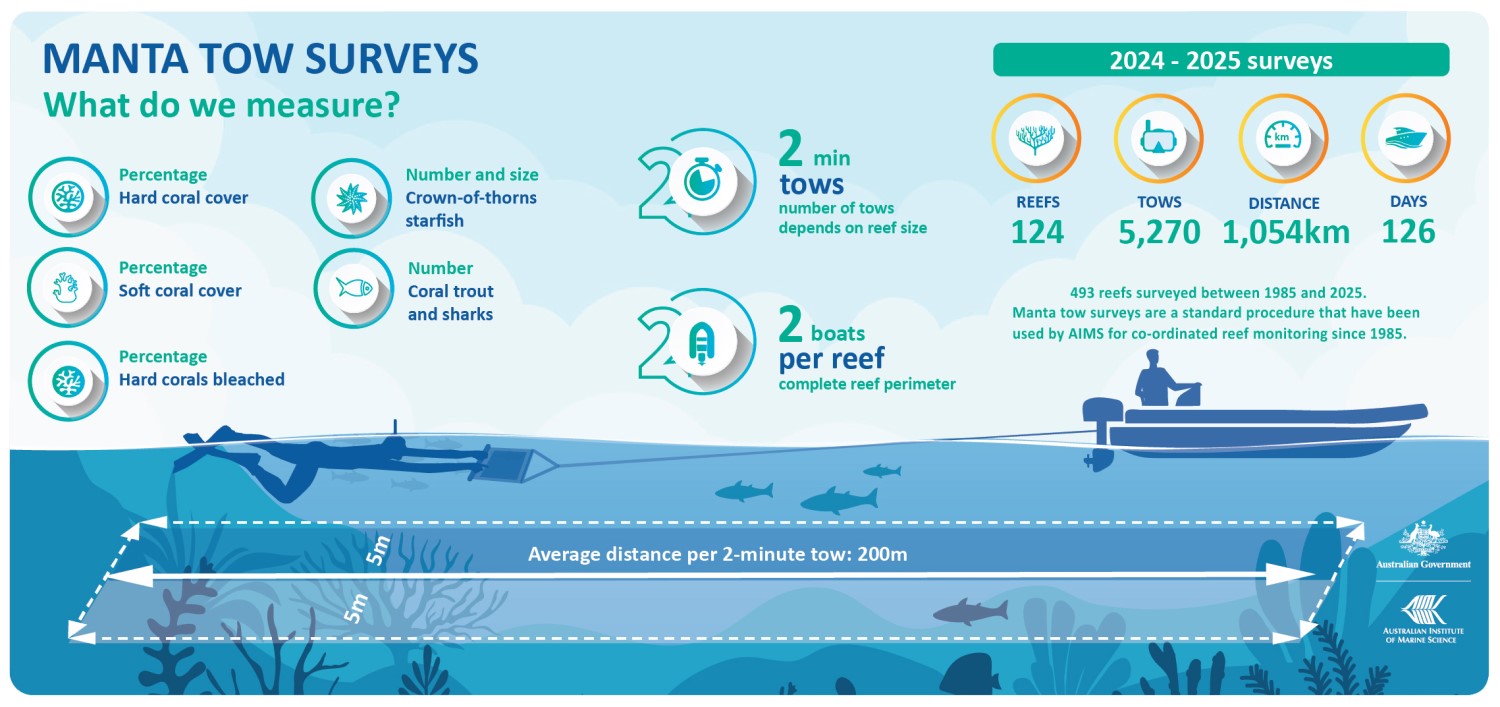
- This report summarises the status (percentage of coral cover) of reefs in the Northern, Central and Southern Great Barrier Reef (GBR) following the 2024 mass coral bleaching event. Data were collected during manta surveys on 124 reefs by the Long-Term Monitoring Program (LTMP) between August 2024 and May 2025 (reported as ‘2025’).
- The 2024 mass coral bleaching event was the fifth mass coral bleaching event on the GBR since 2016 and was part of an ongoing (fourth) global event that began on Northern Hemisphere reefs in 2023 and was declared by the National Oceanic and Atmospheric Administration (NOAA) and the International Coral Reef Initiative (ICRI) in April 2024.
- The 2024 event had the largest spatial footprint ever recorded on the GBR, with high to extreme bleaching prevalence observed across all three regions of the GBR.
- To assess the impact of the 2024 bleaching event, targeted in-water surveys during and after peak bleaching were carried out in addition to LTMP manta tow surveys. Results from both sets of surveys indicate substantial coral mortality, and that decline in coral cover directly relates to coral bleaching severity and the prevalence of high to extreme coral bleaching (>30% coral cover bleached).
- Fast-growing Acropora corals, which facilitated the rapid recovery observed across many reefs between 2017 and 2024, were among the most severely impacted by the bleaching event.
- The summer of 2024 brought multiple stressors to the GBR including cyclones, flooding and crown-of-thorns starfish, but the mass coral bleaching event was the primary source of coral mortality.
- In 2025, hard coral cover declined substantially across the GBR, although considerable coral cover remains in all three regions. Regional declines ranged between 14% and 30% compared to 2024 levels, with some individual reefs experiencing coral declines of up to 70.8%. These declines are primarily attributed to coral mortality from the 2024 mass coral bleaching event, compounded by the cumulative impacts of two cyclones in December 2023 and January 2024, freshwater inundation and some crown-of-thorns starfish activity.
- In 2025, 48% of surveyed reefs underwent a decline in percentage coral cover, 42% showed no net change, and only 10% had an increase. Reefs with stable or increasing coral cover were predominantly located in the Central GBR.
- Of the 124 reefs surveyed, only two reefs had hard coral cover <10%. Most reefs (77) had coral cover between 10% and 30%, 33 reefs had cover between 30% and 50%, 10 reefs had coral cover between 50% and 75%, and the remaining two reefs had >75%.
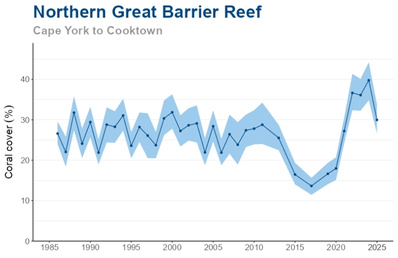
- On the Northern GBR, region-wide average hard coral cover decreased from 39.8% (34.8% – 44.2% credible intervals; CIs) in 2024 to 30.0% (26.6% – 33.8% CIs). This is a decline of 24.8% relative to 2024 levels and the largest annual decline recorded for this region since monitoring began. Despite this, coral cover remains above the long-term average of 26.6%.
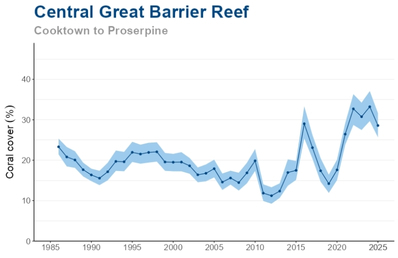
- In 2025 on the Central GBR, region-wide average hard coral cover decreased to 28.6% (25.5% – 31.7% CIs) from a regional high in 2024 (33.2% average; 29.7% – 37.1% CIs). This is a relative decline of 13.9%; however, it is still above the long-term average of 19.8%.
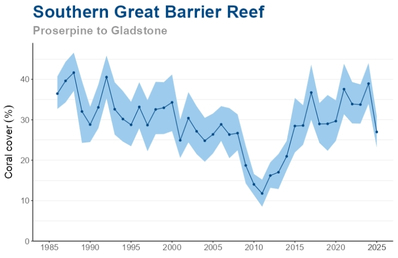
- On the Southern GBR, region-wide average hard coral cover decreased to 26.9% (23.1% – 30.9% CIs) from 38.9% (33.9% – 44.0% CIs) in 2024. This represents a relative decline of 30.6% of 2024 levels, the largest region-wide annual decline yet recorded, which drove regional coral cover below the long-term average of 29.3%.
- Crown-of-thorns starfish (COTS) were detected on 27 surveyed reefs in 2025. One reef in the Southern GBR has a severe outbreak, while three additional reefs in the Southern GBR and two in the Northern GBR have established outbreaks.
- Above-average water temperatures (i.e. sea-surface temperature anomalies of +1°C to +2.5°C) occurred again on the GBR during the austral summer of 2025, peaking in March. As a result, the GBR experienced its sixth mass coral bleaching event since 2016. This current event was largely constrained to the Northern GBR and reefs across the north-west of Australia. LTMP 2025 surveys in the Northern GBR were completed in December 2024, prior to the onset of this coral bleaching event. Its impact on coral cover will be captured in next year’s report.
- Aerial bleaching surveys conducted in March 2025 focused on regions of the GBR that exceeded 4 Degree Heating Weeks, namely the Northern GBR and parts of the Central GBR north of Townsville. Of the 162 inshore and mid-shelf reefs surveyed, 41% had medium to high bleaching prevalence (11% – 60% coral cover bleached). Low to no bleaching was observed on 99% of the offshore reefs in the Northern GBR, and only 9% of the total 258 reefs surveyed had very high bleaching prevalence (>60% coral cover bleached).
- These results demonstrate that the GBR is under severe cumulative pressure and that coral cover gains in recent years were reversed over the 2024 summer. This reversal was anticipated last year, as many coral species are highly vulnerable to elevated heat stress, wave damage and crown-of-thorns starfish predation, all of which continue to impact the GBR.
- Coral bleaching levels and mortality during this ongoing global event have been more severe in other parts of the world, such as the Caribbean, where mortality was high on almost all reefs and very little coral currently remains. The GBR had record high coral cover before the event and fared relatively better because of the level of coral cover prior to the event, its size, the variety of interconnected habitats, and the range of heat stress levels experienced by different regions.
- The GBR currently retains higher coral cover than many reefs globally; however, mass coral bleaching events are now occurring with increasing frequency, while recovery periods are decreasing both at the scale of individual reef systems like the GBR and at the scale of reefs globally.
Download the 2024/2025 report | 6.7MB
More information
- Download the 2024-2025 Report
- Take a 'Quick Look' at the 2024-2025 results
- Read the media release
- Learn more about AIMS Long-Term Monitoring Program
- Visit the Reef Dashboard for data on individual reefs and sectors
- Access the data: AIMS Long-Term Monitoring Program: Crown-Of-Thorns Starfish And Benthos Manta Tow Data (Great Barrier Reef)
- Contact media@aims.gov.au